Inspecting Deployed APIs
Selecting a deployed API in the dashboard opens a corresponding details panel to the right containing 3 tabs:
- API Definition: Shows an extended Swagger UI for the OpenAPI that was deployed to Kusk Gateway.
- Kusk Extensions: Shows an overview of all
x-kuskextensions in the deployed OpenAPI definition. - Public API Definition: Shows Swagger UI for the OpenAPI definition that would be exposed to consumers.
API Definition Tab
The API definition tab shows a Swagger UI for the deployed API definition - together with a table of contents at the top, making it easy to navigate to individual operations.
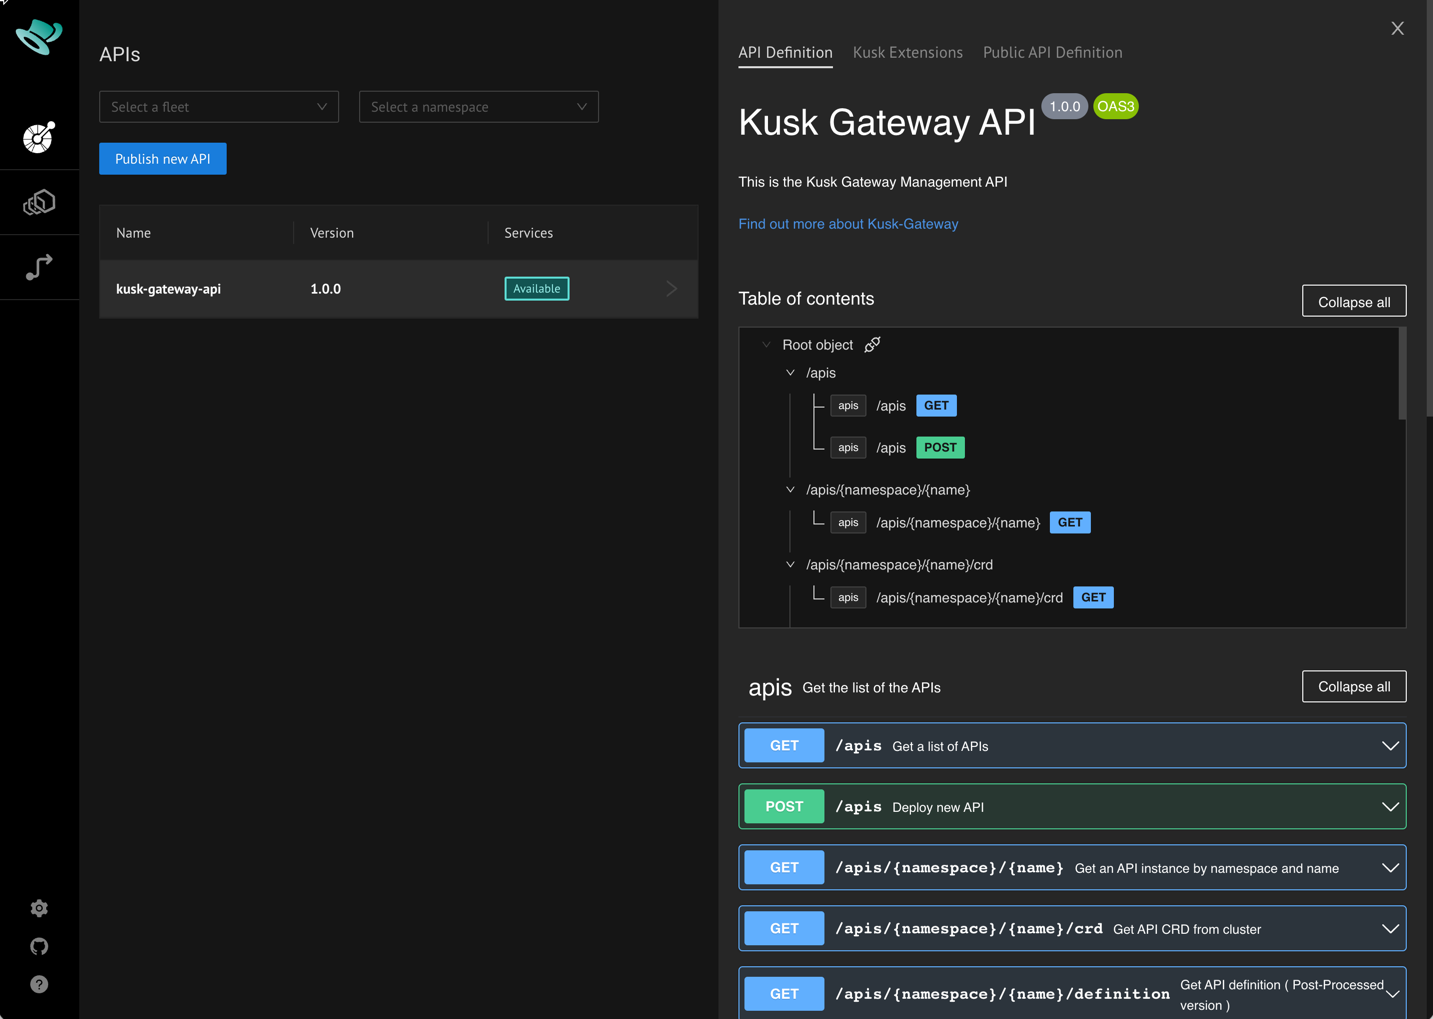
An indicator is shown next to any level in the Table of Contents if there is a x-kusk extension defined.
Clicking it will open the corresponding extension in the Kusk Extensions tab (see below).
![]()
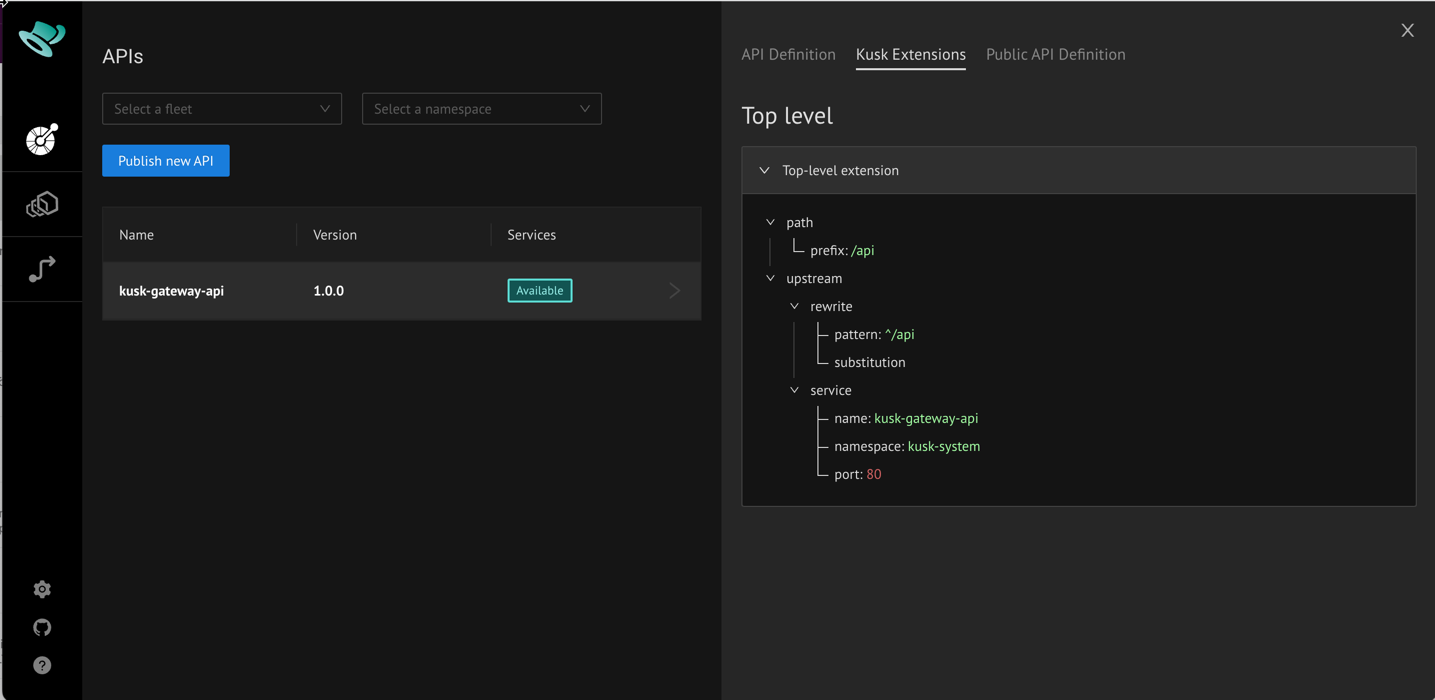
Kusk Extensions Tab
The Kusk Extensions tab contains a tree view showing all x-kusk extensions that have been specified in the
deployed OpenAPI definition - making it easy to understand how the API has been configured for Kusk Gateway.
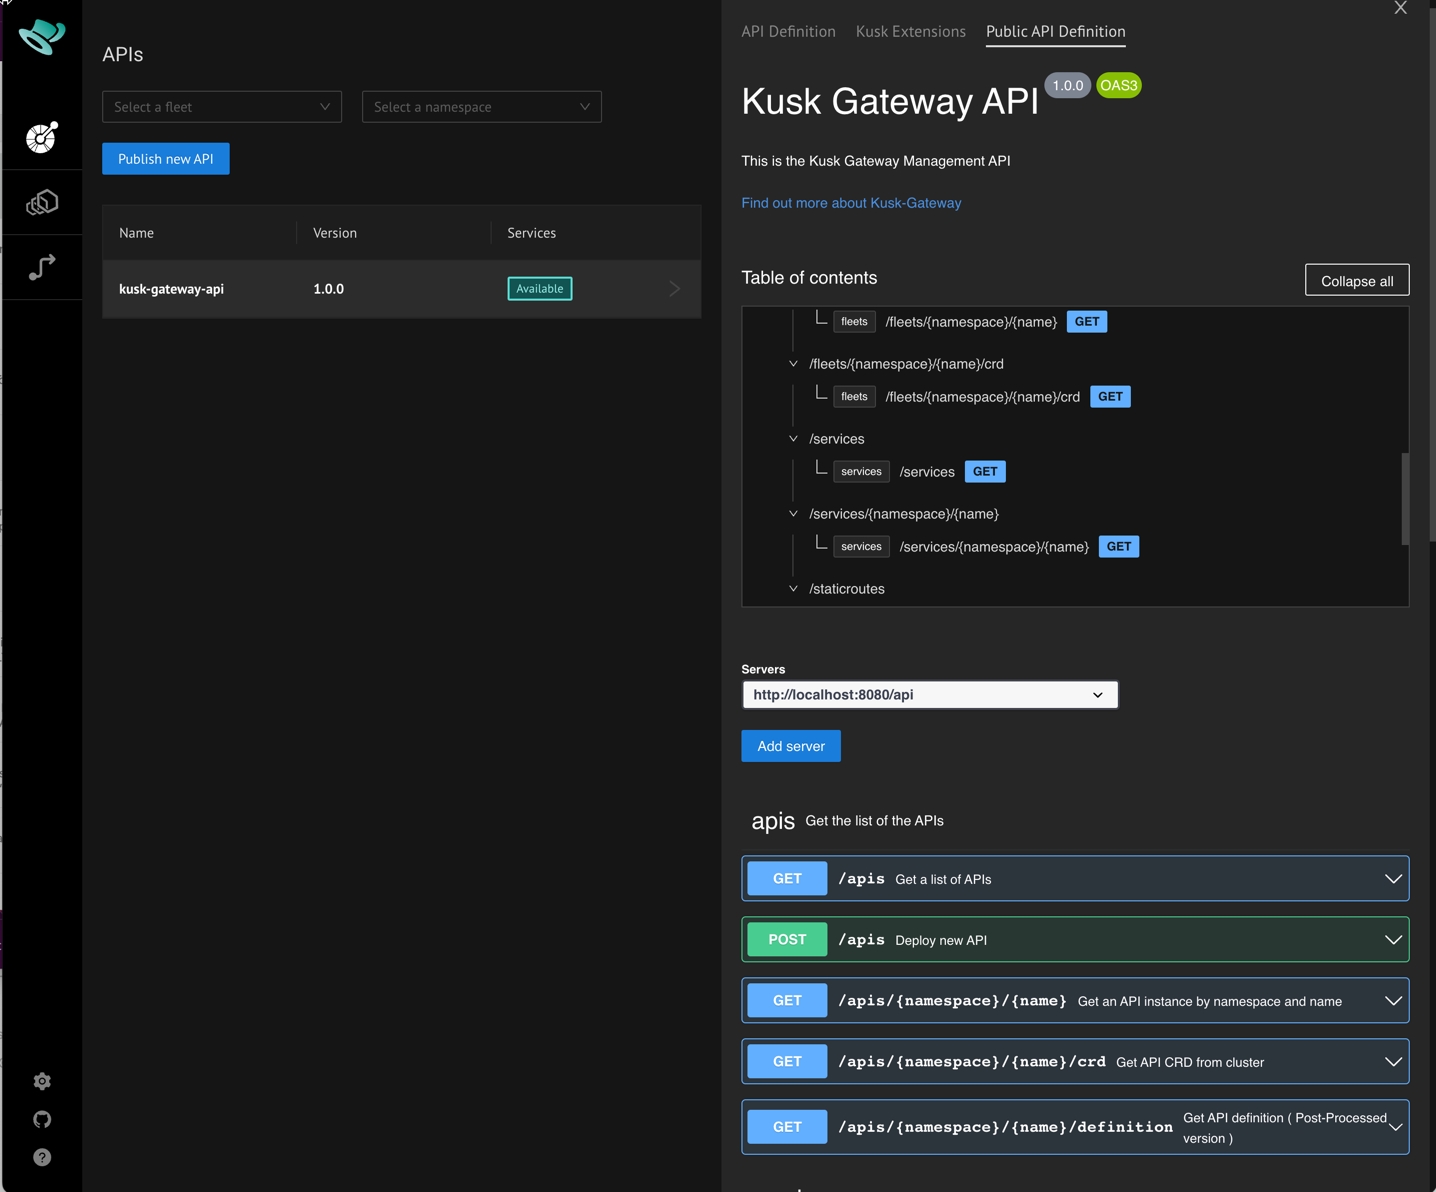
Public API Definition Tab
The Public API Definition tab contains the "post-processed" OpenAPI definition as you would provide publicly to consumers of your API. This differs from the deployed OpenAPI definition in the following ways:
- All
x-kuskextensions have been removed. - All disabled operations have been removed - see Disabling Operations.
A Table of Contents is available as in the API Definition tab.
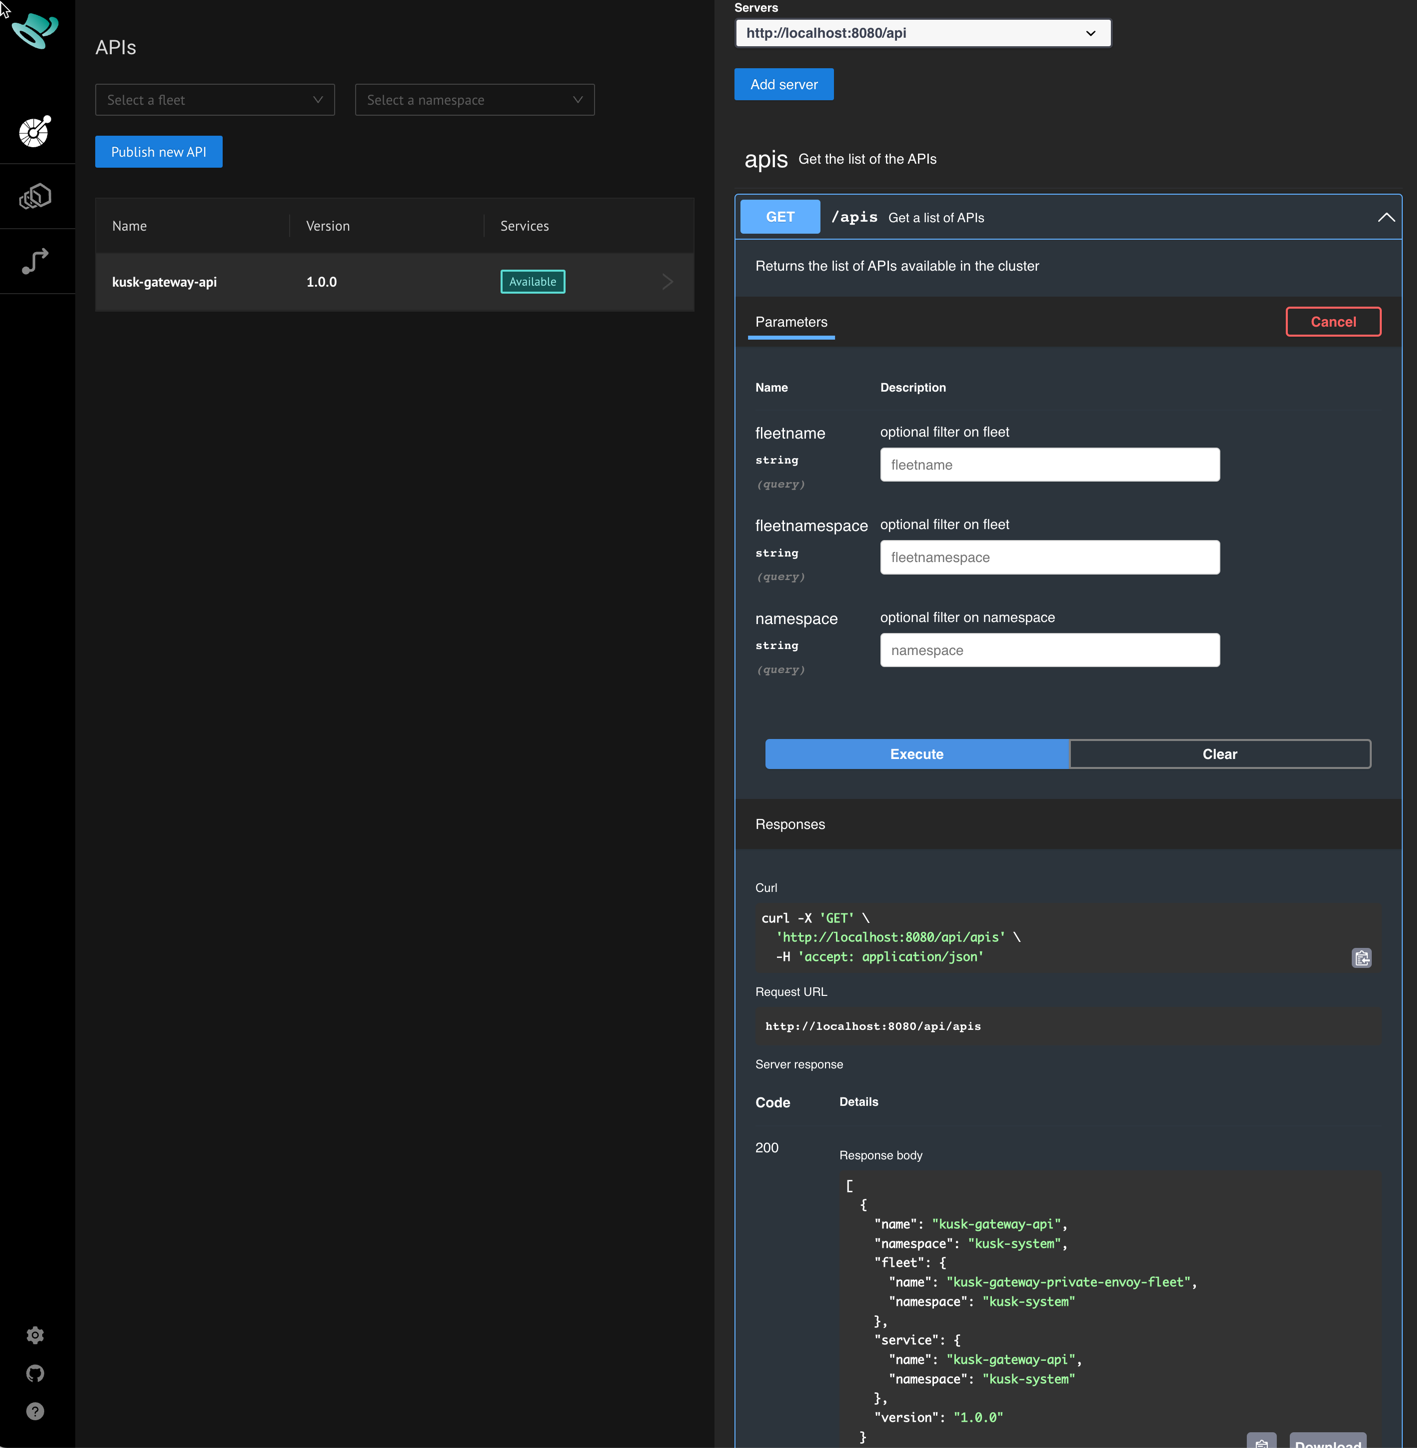
This tab includes the possibility to specify server(s) to be used when executing requests through the integrated Swagger UI:
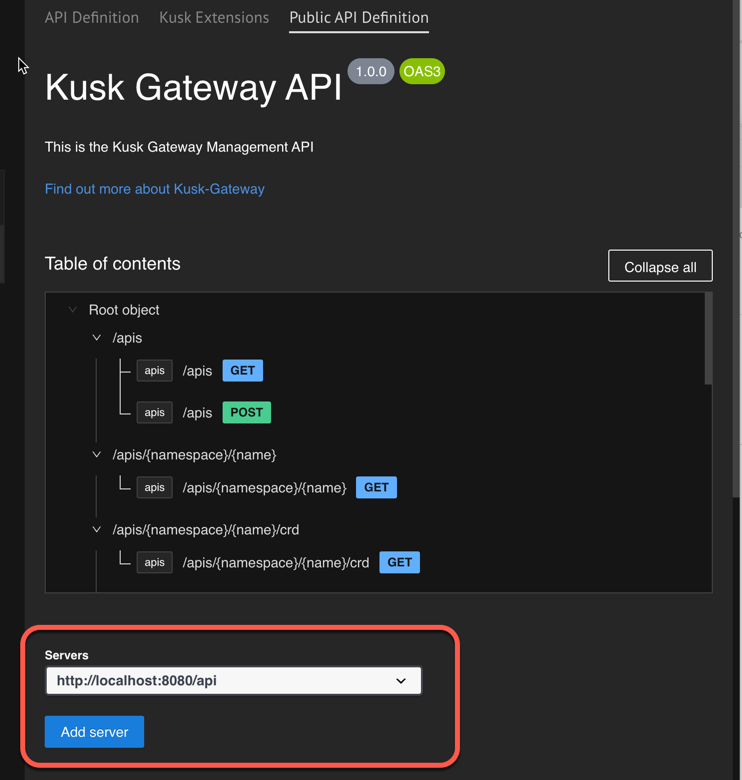
Specifying the server used by the dashboard itself allows us to execute requests against the Dashboard API. For example,
to get a list of APIs (as seen in the dashboard), we can execute the GET /apis operation.